

How do we know what's inside a star?
How do we know what's inside a star?
The world of spectroscopy!

Coming Soon! Join here for an exciting early bird discount on the launch!
You might have heard that our Sun is made up of Hydrogen which undergoes fusion producing Helium. You might have heard about what our planets are made up of, too. But have you ever wondered how do we know what exactly a star, a planet or any celestial body is made of?
Enter the fascinating world of astronomical spectroscopy, a powerful tool that allows astronomers to unravel the composition of stars and other celestial objects.
Understanding Spectroscopy
What is Spectroscopy? Imagine you have a prism, and you shine white light through it. The light splits into a rainbow of colors, revealing its constituent wavelengths. Spectroscopy operates on a similar principle but on a much grander scale. It's the study of how light interacts with matter, revealing valuable information about the composition, temperature, density, and motion of celestial objects.

Types of Spectroscopy: Absorption and Emission There are two main types of spectroscopy: absorption and emission.
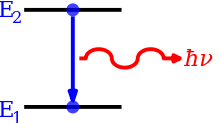
Emission Spectroscopy examines the wavelengths of photons emitted by atoms or molecules during their transition from an excited state to a lower energy state. Each element emits a characteristic set of discrete wavelengths according to its electronic structure, and by observing these wavelengths the elemental composition of the sample can be determined.
The below image is the emission spectrum of the Hydrogen element.

Now, as the number of electrons in an atom increases, the spectrum can have multiple emission lines. For example, consider the emission spectral lines of Iron.

What is important for us is that every element has a unique spectral line, often considered as its: “fingerprint.”
Absorption Spectroscopy measures the absorption of electromagnetic radiation, as a function of frequency or wavelength, due to its interaction with a sample. Consider it the reverse of emission spectroscopy. The sample absorbs energy, i.e., photons, from the radiating field. The intensity of the absorption varies as a function of frequency, and this variation is the absorption spectrum.
The absorption spectrum of a sample will show a continuous band interrupted by dark lines which are exactly at the same location where the emission lines of that element in the sample would show.

Hot solid objects produce light with a continuous spectrum, hot gases emit light at specific wavelengths, and hot solid objects surrounded by cooler gases show a near-continuous spectrum with dark lines corresponding to the emission lines of the gases.
Example: Decoding the Sun's Spectrum
Let's take a closer look at the Sun, our nearest star, to understand how spectroscopy works in practice.
When scientists analyze sunlight using spectroscopy, they observe a continuous spectrum with dark absorption lines superimposed. These lines are like a cosmic barcode, revealing the presence of different elements in the Sun's atmosphere. Each element absorbs light at specific wavelengths, creating a unique pattern of absorption lines.

For instance, the prominent dark lines in the Sun's spectrum correspond to elements such as hydrogen, helium, calcium, and iron. By identifying these spectral lines and comparing them to laboratory measurements of known elements, astronomers can determine the chemical composition of the Sun and other stars.

Consider the above image. By using the combined absorption and emission spectroscopy techniques we can also identify the elements present in the gases and clouds surrounding the celestial body.
Not just elements, but also their amounts
By comparing the spectrum we can identify which elements are present. We can go further from this too. We can also find out the relative strength and proportion of different elements as well.
Equivalent width
The equivalent width of a spectral line is a measure of the area of the line on a plot of intensity versus wavelength in relation to underlying continuum level. It is found by forming a rectangle with a height equal to that of continuum emission, and finding the width such that the area of the rectangle is equal to the area in the spectral line.

The spectrum of our Sun is shown below. While these curves can appear very complicated (they are!) and not so inviting for first-time learners, the basics fundamentals are simple to understand.

So, we discussed astronomical spectroscopy as a powerful tool that enables astronomers to peer into the heart of stars and other celestial bodies and decipher their chemical makeup. By analyzing the subtle fingerprints encoded in starlight, scientists can unravel the complex processes occurring within stars and gain insights into the fundamental properties of the universe.
So, the next time you gaze up at the night sky, remember that each twinkling star holds within it a treasure trove of information, waiting to be unlocked through the magic of spectroscopy.